澳大利亚课程类别
ACMSP096
Construct suitable data displays, with and without the use of digital technologies, from given or collected data. Include tables, column graphs and picture graphs where one picture can represent many data values
16 teaching resources for those 'aha' moments
-

teaching resource
Colossal Cinemas: Which Popcorn Popper? – Project
一个鼓励学生使用帝国和习惯单位来测量爆米花爆米花和产生的爆米花的项目。
-
teaching resource
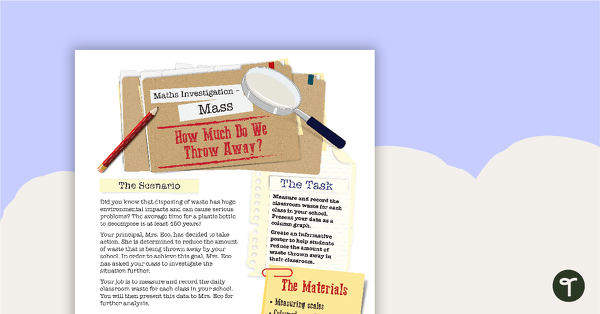
大众数学调查 - 我们要扔掉多少?
A mathematics investigation about measuring mass, embedded in a real-world context.
-

teaching resource
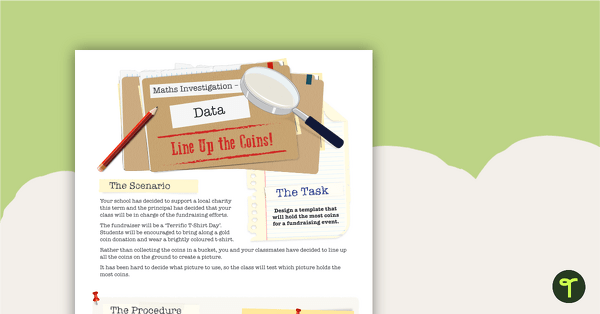
Data Maths Investigation - Which Reward?
A mathematics investigation involving data collection and representation, embedded in a real-world context.
-
teaching resource
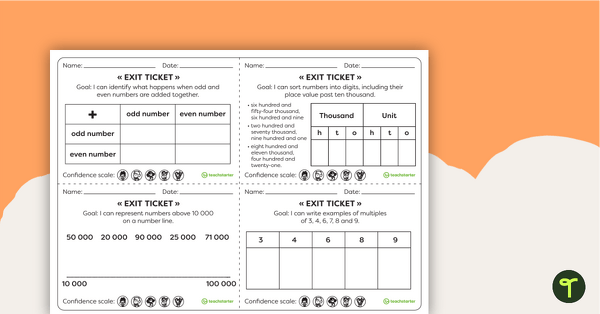
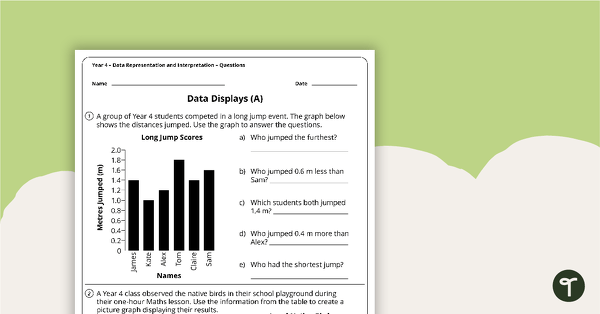
Data Representation and Interpretation Worksheets - Year 4
4 data representation and interpretation worksheets linked to the Australian Curriculum.
-

teaching resource
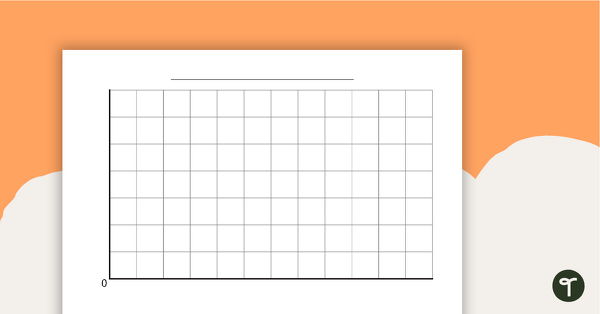
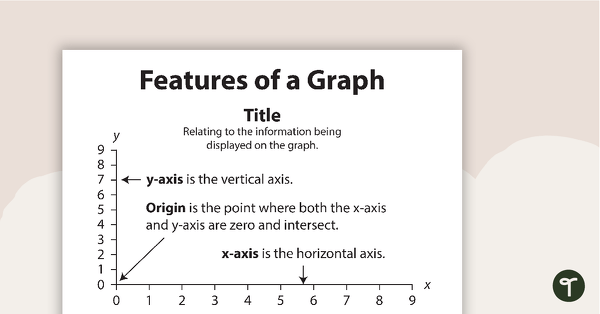
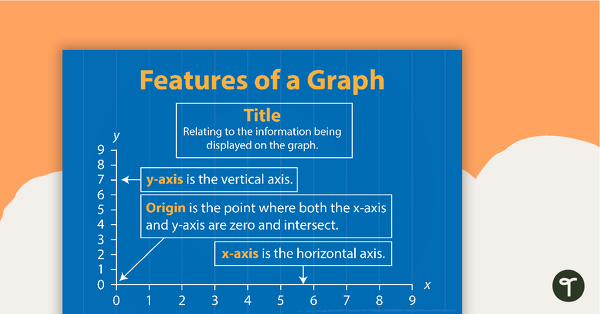
图形的类型海报和工作表
A collection of posters displaying the different types of graphs along with matching worksheets to assist students with laying out graphs on the page.
-

teaching resource
Types of Graphs Posters with Labels
6 posters showing the features and examples of picture graphs, pie charts, line graphs, bar graphs, column graphs and histograms.
-

teaching resource
Types of Graphs Posters
6 posters showing the features and examples of picture graphs, pie charts, line graphs, bar graphs, column graphs and histograms.