Australian Curriculum Categories
ACMSP119
Construct displays, including column graphs, dot plots and tables, appropriate for data type, with and without the use of digital technologies
8 teaching resources for those 'aha' moments
-

teaching resource
Creating a Graph Using Digital Technologies
A worksheet that supports students when collecting initial data and creating a digital graph.
-

teaching resource
Chance and Data Maths Investigation - Roll Me a Six!
A mathematics investigation involving chance and data, embedded in a real-world context.
-

teaching resource
Maths Warm Ups PowerPoint - Year 5
A PowerPoint providing a series of warm up activities for Year 5 students across the curriculum.
-

teaching resource
Colossal Cinemas: Which Popcorn Popper? – Project
A project that encourages students to use imperial and customary units to measure popcorn poppers and the popcorn they produce.
-
teaching resource
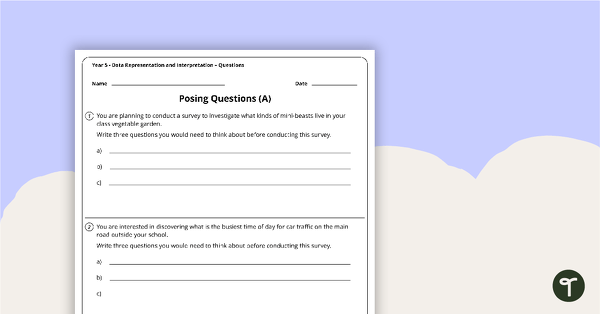
Data Representation and Interpretation Worksheets - Year 5
8 data representation and interpretation worksheets linked to the Australian Curriculum.
-

teaching resource
Numeracy Assessment Tool - Year 5
A set of 6 numeracy assessment tools suited to Year 5 students
-

teaching resource
Types of Graphs Posters and Worksheets
A collection of posters displaying the different types of graphs along with matching worksheets to assist students with laying out graphs on the page.
-

teaching resource
Types of Graphs Posters with Labels
6 posters showing the features and examples of picture graphs, pie charts, line graphs, bar graphs, column graphs and histograms.